Research & Publications
Working papers, frameworks, and explainers from Carbon Finance Labs. Cost curves, carbon accounting, and removal markets — written to be cited, not just read.
Need a number to cite?
Every finding has its own URL. Copy the citation, get back to your deadline. Start with the cost-curve papers.
Browse findings →Building a portfolio or strategy?
Frameworks for risk (CaR), portfolio construction (CaRPS), and credit grading (CarbonGrade). Read in roughly that order.
Browse frameworks →Defending a carbon strategy?
Accounting, ledgers, ontology. Each piece comes with a 90-second TL;DR. The 60-page version is there if your CFO asks for it.
Browse accounting →Cost Curves & Learning Rates
5Wright’s Law applied to single technologies and to the whole economy. The fastest cost decline ever measured (GPU compute, 89%) and the rate civilisation is actually learning at (carbon 22% vs the 52% Paris needs).
 Briefing
The Infrastructure Carbon Curve: Ten Build-Outs, Ten Abatement-Cost Curves
A plain-language marginal abatement cost curve (MACC) across ten infrastructure build-outs — roads, bridges, water, wastewater, grids, power generation, rail, ports, data centers and buildings. Built and operational carbon, $/tCO₂e, and cost per functional unit, across seven regions (US, EU, Asia, Australia, India, Japan, Brazil). Built on Infrastructure Australia, Carbon Leadership Forum/RMI, GCCA, IEA and Ember data (2022–2026), with CarbonSig research-tool notes. Closes on removals, ISO 14068, and the cost of reaching neutral.
Cite
Carbon Finance Lab (2026). The Infrastructure Carbon Curve: Ten Build-Outs, Ten Abatement-Cost Curves. Carbon Finance Lab. https://carbonfinancelab.com/infrastructure-carbon-curve/
@misc{infrastructure_carbon_curve_2026,
  author = {Carbon Finance Lab},
  title = {The Infrastructure Carbon Curve: Ten Build-Outs, Ten Abatement-Cost Curves},
  year = {2026},
  publisher = {Carbon Finance Lab},
  howpublished = {\url{https://carbonfinancelab.com/infrastructure-carbon-curve/}}
}
Paper
Paper
The Global Learning Rate: Planetary Resource Efficiency, 1900–2023
Treats the whole economy as a single technology and asks whether it has an experience curve. It does. Energy intensity falls 18.3% per doubling of cumulative GDP, carbon 22.2%, materials a statistically insignificant 6.5%. Internalise unpriced damages and the inclusive rate falls to ~12.4% — meaning roughly 38% of apparent global progress is cost-shifting to the biosphere, not learning.
Cite
Gogerty, N. (2026). The Global Learning Rate: Planetary Resource Efficiency, 1900–2023. Carbon Finance Lab. https://carbonfinancelab.com/global-learning-rate/
@misc{global_learning_rate_2026,
  author = {Gogerty, N.},
  title = {The Global Learning Rate: Planetary Resource Efficiency, 1900–2023},
  year = {2026},
  publisher = {Carbon Finance Lab},
  howpublished = {\url{https://carbonfinancelab.com/global-learning-rate/}}
}
Paper
Paper
Experience Curves Extended: Wright's Law Across 150 Technologies
Updates the Performance Curve Database to 2024 and adds the two domains everyone is arguing about: carbon removal (5–16% learning rates, comparable to early solar) and AI compute (89.1% — the highest ever measured). Median learning rate across 97 technologies: 20.9%.
Cite
Gogerty, N. (2025). Experience Curves Extended: Wright's Law Across 150 Technologies. Carbon Finance Lab. https://carbonfinancelab.com/wrights-law-extended/
@misc{wrights_law_extended_2025,
  author = {Gogerty, N.},
  title = {Experience Curves Extended: Wright's Law Across 150 Technologies},
  year = {2025},
  publisher = {Carbon Finance Lab},
  howpublished = {\url{https://carbonfinancelab.com/wrights-law-extended/}}
}
Interactive
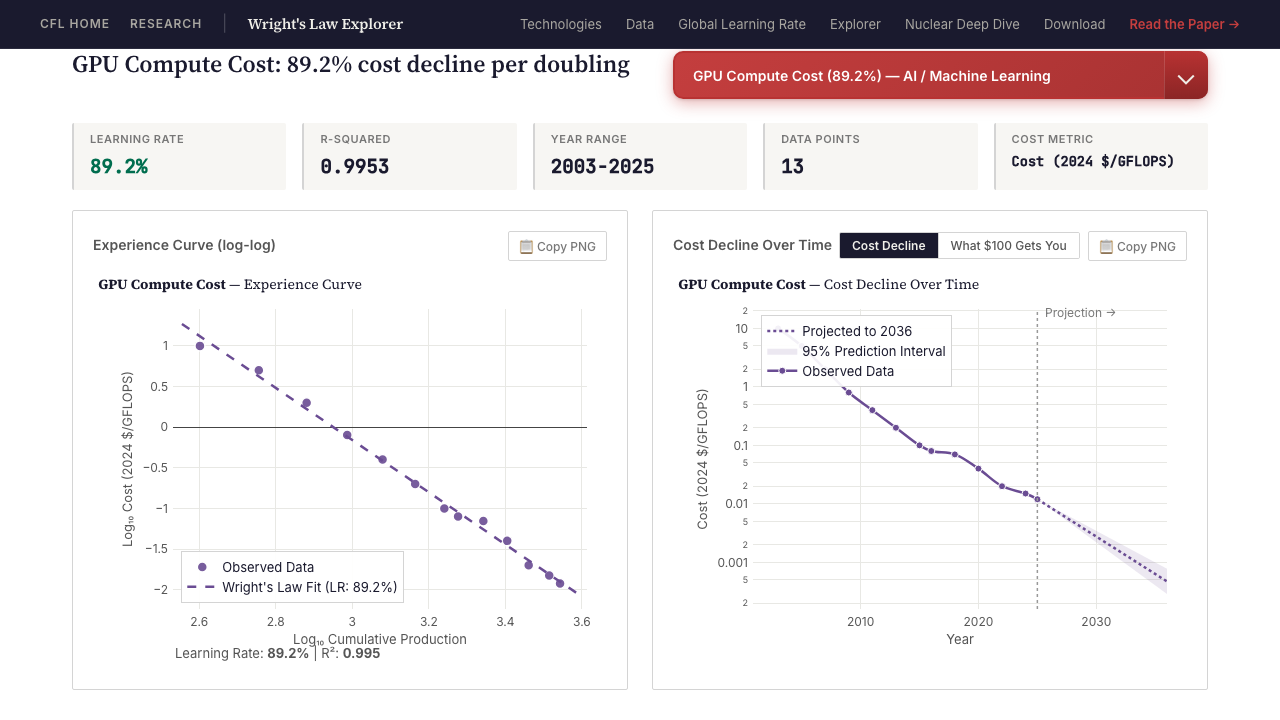
Wright's Law Explorer: 155 technologies, 167 years of cost data
Search, filter, compare learning rates across 155 technologies. Plotly-driven scatter and log-log experience curves with projections to 2036. Data freely downloadable. The interactive companion to the paper above.
Cite
Carbon Finance Lab (2026). Wright's Law Explorer: 155 technologies, 167 years of cost data. Carbon Finance Lab. https://carbonfinancelab.com/wrights-law/
@misc{wrights_law_explorer_2026,
  author = {Carbon Finance Lab},
  title = {Wright's Law Explorer: 155 technologies, 167 years of cost data},
  year = {2026},
  publisher = {Carbon Finance Lab},
  howpublished = {\url{https://carbonfinancelab.com/wrights-law/}}
}
Interactive
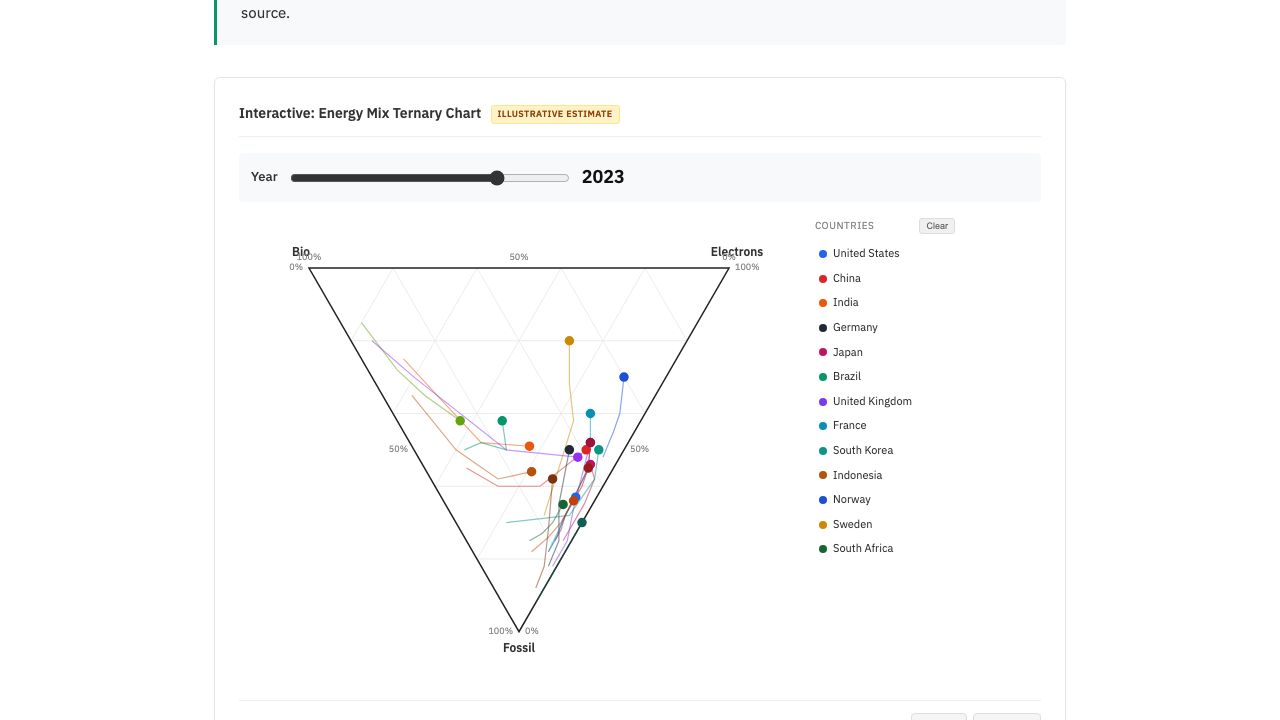
The Global Energy Transition, Explained
A plain-language walk through the shift from burning fossil fuels directly to running on electricity, across 20 countries and five decades. Interactive ternary chart, electrification rankings, speed-of-change, and a 2040 scenario. Figures are illustrative estimates — simplified to show direction and relative position, not exact national statistics; the 2040 column is an accelerated-electrification scenario, not a forecast. Every chart is downloadable as an image and embeddable with attribution.
Cite
Carbon Finance Lab (2026). The Global Energy Transition, Explained. Carbon Finance Lab. https://carbonfinancelab.com/global-energy-transition/
@misc{energy_transition_2026,
  author = {Carbon Finance Lab},
  title = {The Global Energy Transition, Explained},
  year = {2026},
  publisher = {Carbon Finance Lab},
  howpublished = {\url{https://carbonfinancelab.com/global-energy-transition/}}
}Pricing, Risk & Valuation
4What a tonne of removal is worth, and what it is worth at risk. Option value in forward contracts, Value-at-Risk for delivery, portfolio construction, and the network capital that makes markets liquid — the financial layer between cost curves and procurement.
 Interactive
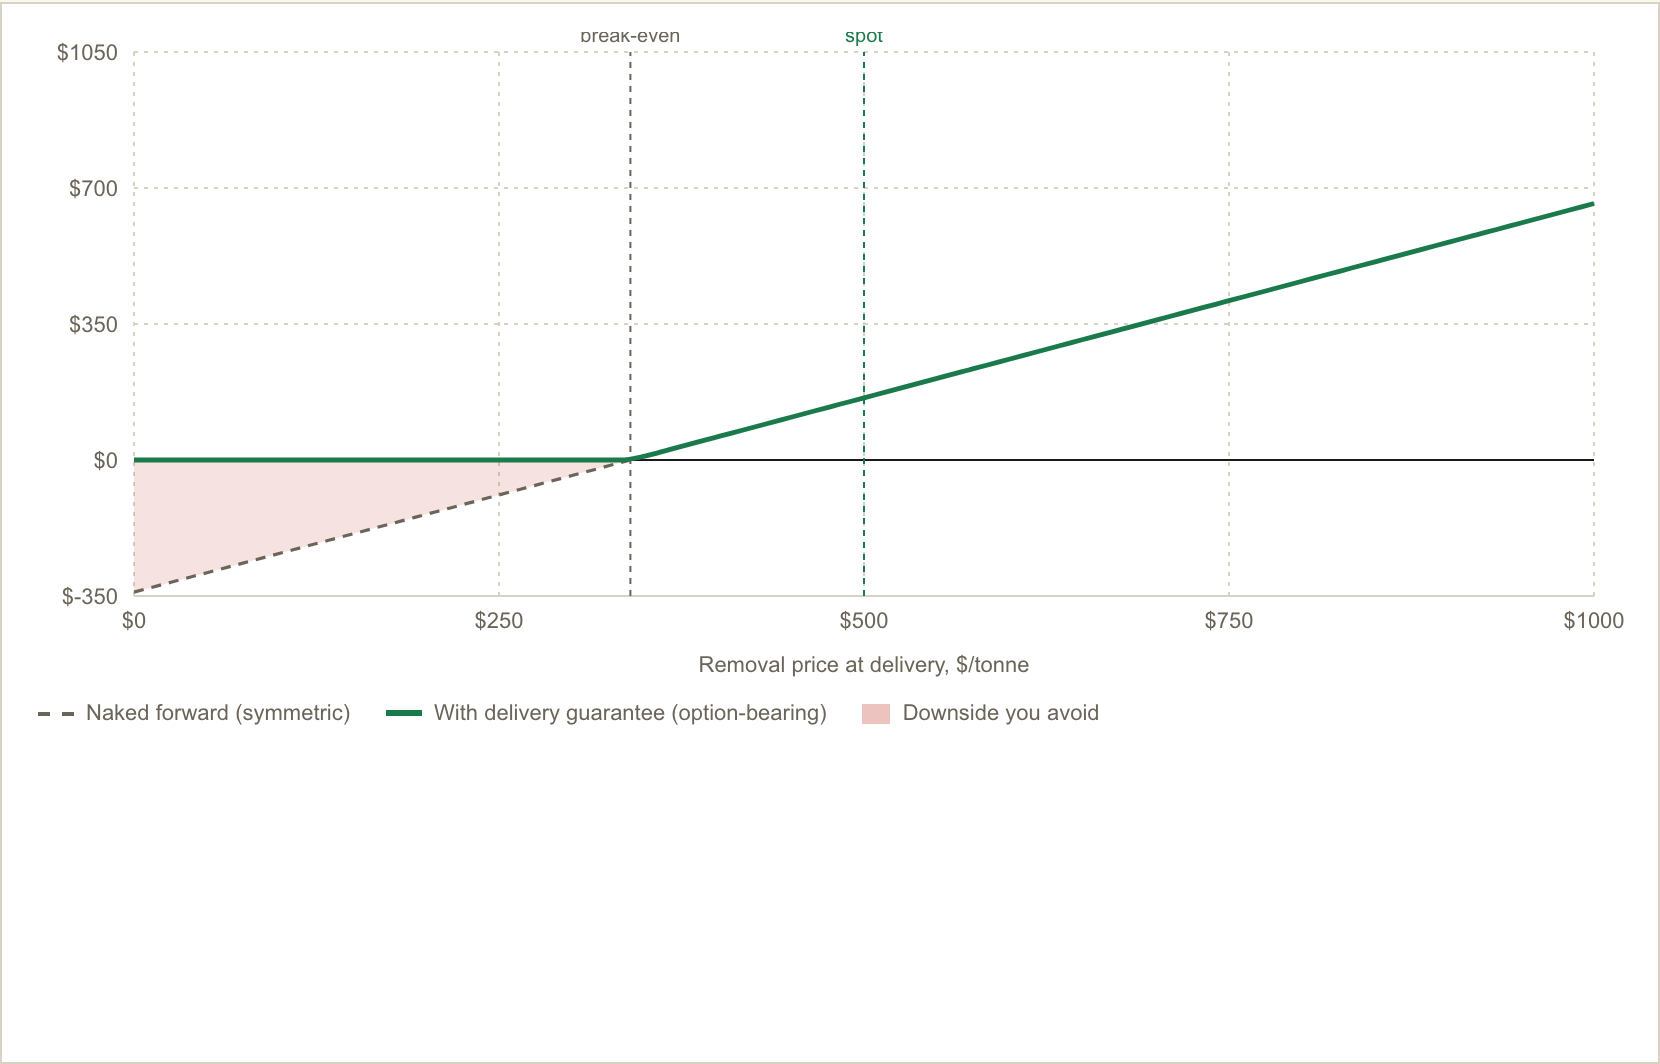
The free option inside a carbon-removal forward
Buy a tonne of durable removal for delivery years out, at a price set today, and you are not just procuring carbon — you are holding a call option. Where delivery is guaranteed and net-zero demand is committed, the downside is truncated and the upside rides a scarce, policy-driven price. Two interactive widgets put a defensible number on the embedded optionality using EU ETS volatility (54%) and CDR forward-price dispersion (~45%). Caveat in the open: this holds only under truncated downside, and it is a market-mispricing finding, not a trading recommendation.
Cite
Carbon Finance Lab (2026). The free option inside a carbon-removal forward. Carbon Finance Lab. https://carbonfinancelab.com/removal-forward-option/
@misc{removal_forward_option_2026,
  author = {Carbon Finance Lab},
  title = {The free option inside a carbon-removal forward},
  year = {2026},
  publisher = {Carbon Finance Lab},
  howpublished = {\url{https://carbonfinancelab.com/removal-forward-option/}}
}
Framework
Carbon at Risk (CaR): Performance Risk for Removal
Applies Value-at-Risk methodology from financial markets to carbon removal. Replaces binary classifications with a quantified delivery and storage risk. Backed by 20+ institutions, includes an interactive CaR Calculator. The risk lens for a removal portfolio.
Cite
Carbon Finance Lab (2025). Carbon at Risk (CaR): Performance Risk for Removal. Carbon Finance Lab. https://www.carbonatrisk.org/
@misc{carbon_at_risk_2025,
  author = {Carbon Finance Lab},
  title = {Carbon at Risk (CaR): Performance Risk for Removal},
  year = {2025},
  publisher = {Carbon Finance Lab},
  howpublished = {\url{https://www.carbonatrisk.org/}}
}
Framework
Carbon Removal Portfolio Standard (CaRPS) v2.1
The portfolio problem for institutional buyers: how to diversify across technologies, geographies, and risk profiles while still hitting performance targets. v2.1 refines the metrics and extends them to corporate net-zero commitments and sovereign climate funds. Pairs with CaR for the risk leg.
Cite
Carbon Finance Lab (2026). Carbon Removal Portfolio Standard (CaRPS) v2.1. Carbon Finance Lab. https://carbonfinancelab.com/carps/
@misc{carps_2026,
  author = {Carbon Finance Lab},
  title = {Carbon Removal Portfolio Standard (CaRPS) v2.1},
  year = {2026},
  publisher = {Carbon Finance Lab},
  howpublished = {\url{https://carbonfinancelab.com/carps/}}
}
Paper
Paper
Network Capital: A Framework for Carbon Markets
Carbon markets remain stubbornly fragmented, illiquid, and opaque despite being designed to harness decentralised exchange. The missing ingredient is network capital — self-reinforcing value from dense webs of participant trust and information flow. Focuses on standards, interoperability, and connective tissue.
Cite
Carbon Finance Lab (2026). Network Capital: A Framework for Carbon Markets. Carbon Finance Lab. https://carbonfinancelab.com/network-capital/
@misc{network_capital_2026,
  author = {Carbon Finance Lab},
  title = {Network Capital: A Framework for Carbon Markets},
  year = {2026},
  publisher = {Carbon Finance Lab},
  howpublished = {\url{https://carbonfinancelab.com/network-capital/}}
}Removal & Markets
3Scaling removal capacity and the policy machinery around it — the CBAM border, gigatonne ramp arithmetic, and the unintended consequences of well-meant climate policy.
 Briefing
The Carbon-Price Convertor: A Stakeholder's Atlas to Brussels' CBAM Fine Print
An independent reading of the EU's draft Commission Implementing Regulation (Ref. Ares(2026)4841230) on how foreign carbon prices convert into fewer CBAM certificates. The draft does three things at once: sets the maths for the conversion; polices what counts — only mandatory taxes or trading schemes, with rebates netted out and offsets capped at 10%; and appoints accredited independent verifiers working off a single English-language template. Ten charts map the machinery, the decision tree, the cost stack for a tonne of steel, and the system-level ripples. Written for ten distinct constituencies, from EU importers to third-country regulators.
Cite
Carbon Finance Lab (2026). The Carbon-Price Convertor: A Stakeholder's Atlas to Brussels' CBAM Fine Print. Carbon Finance Lab. https://carbonfinancelab.com/cbam-convertor/
@misc{cbam_convertor_2026,
  author = {Carbon Finance Lab},
  title = {The Carbon-Price Convertor: A Stakeholder's Atlas to Brussels' CBAM Fine Print},
  year = {2026},
  publisher = {Carbon Finance Lab},
  howpublished = {\url{https://carbonfinancelab.com/cbam-convertor/}}
}
Paper
Paper
The Removals Ramp: Restructured
The arithmetic of net zero is unforgiving. Maps scaling pathways, cost trajectories, and institutional mechanisms for gigaton-scale removal. 2026 update incorporates updated learning rates and expanded treatment of procurement mandates and advance market commitments.
Cite
Carbon Finance Lab (2026). The Removals Ramp: Restructured. Carbon Finance Lab. https://carbonfinancelab.com/removals-ramp/
@misc{removals_ramp_2026,
  author = {Carbon Finance Lab},
  title = {The Removals Ramp: Restructured},
  year = {2026},
  publisher = {Carbon Finance Lab},
  howpublished = {\url{https://carbonfinancelab.com/removals-ramp/}}
}
Field notes
Forced Errors & Gains in Economic Potential Capacities
Well-intentioned climate policies tend to produce unintended consequences. Models how regulatory interventions — carbon pricing floors, technology mandates, subsidy regimes — create windfalls and dead weight in the carbon-removal landscape, identifying both forced errors and latent gains.
Cite
Carbon Finance Lab (2026). Forced Errors & Gains in Economic Potential Capacities. Carbon Finance Lab. https://carbonfinancelab.com/forced-errors/
@misc{forced_errors_2026,
  author = {Carbon Finance Lab},
  title = {Forced Errors & Gains in Economic Potential Capacities},
  year = {2026},
  publisher = {Carbon Finance Lab},
  howpublished = {\url{https://carbonfinancelab.com/forced-errors/}}
}Carbon Accounting & Ledgers
8The plumbing layer. Ontology, ledgers, grading systems, and explainers — the unglamorous work that has to happen before carbon can be priced or traded credibly.
 Framework
COMET: Carbon Ontology for Markets, Emissions & Trade
Carbon data is everywhere; almost none of it speaks the same language. COMET is a free, community-governed meta-ontology aligning ISO 14067, PACT v3, GHG Protocol, and EU CBAM into a single interoperable knowledge graph. Seven semantic layers, a 36-month roadmap to v1.0.
Cite
Carbon Finance Lab (2025). COMET: Carbon Ontology for Markets, Emissions & Trade. Carbon Finance Lab. https://nickgogerty.github.io/comet-ontology/
@misc{comet_2025,
  author = {Carbon Finance Lab},
  title = {COMET: Carbon Ontology for Markets, Emissions & Trade},
  year = {2025},
  publisher = {Carbon Finance Lab},
  howpublished = {\url{https://nickgogerty.github.io/comet-ontology/}}
}
Framework
CarbonGrade: Market Trust Framework
Trust is the scarcest commodity in carbon markets. CarbonGrade compresses additionality, permanence, measurement rigour, and co-benefits into a single comparable score, modelled on bond and equity rating frameworks. Trust infrastructure on which a liquid, credible carbon market can be built.
Cite
Carbon Finance Lab (2026). CarbonGrade: Market Trust Framework. Carbon Finance Lab. https://carbonfinancelab.com/carbongrade/
@misc{carbongrade_market_trust_2026,
  author = {Carbon Finance Lab},
  title = {CarbonGrade: Market Trust Framework},
  year = {2026},
  publisher = {Carbon Finance Lab},
  howpublished = {\url{https://carbonfinancelab.com/carbongrade/}}
}
Field notes
E-Liabilities: CarbonGrade Illustrated
Corporate balance sheets have long treated the atmosphere as a free dumping ground. E-Liabilities tracks carbon emitted in production through supply chains and recognises it on financial statements with the same rigour as debt. Walks through the mechanics of measurement, reporting, and pricing — the procurement-and-capital-allocation consequences of doing this honestly.
Cite
Gogerty, N. (2026). E-Liabilities: CarbonGrade Illustrated. Carbon Finance Lab. https://carbonfinancelab.com/e-liabilities/
@misc{e_liabilities_2026,
  author = {Gogerty, N.},
  title = {E-Liabilities: CarbonGrade Illustrated},
  year = {2026},
  publisher = {Carbon Finance Lab},
  howpublished = {\url{https://carbonfinancelab.com/e-liabilities/}}
}
Framework
Carbon Framework: Swiss Implementation
Translates general carbon-market design principles into the context of Swiss law and institutions. Maps the regulatory interfaces between environmental and financial regulation. A working template for other small, open economies looking to do this credibly.
Cite
Carbon Finance Lab (2026). Carbon Framework: Swiss Implementation. Carbon Finance Lab. https://carbonfinancelab.com/swiss-framework/
@misc{swiss_framework_2026,
  author = {Carbon Finance Lab},
  title = {Carbon Framework: Swiss Implementation},
  year = {2026},
  publisher = {Carbon Finance Lab},
  howpublished = {\url{https://carbonfinancelab.com/swiss-framework/}}
}
Infographic
CarbonGrade Methodology Infographic
CarbonGrade methodology, grading criteria, and implementation architecture in a single visual. Designed for conference panels and policy-brief annexes. The fastest way to explain CarbonGrade to someone who has 90 seconds.
Cite
Carbon Finance Lab (2026). CarbonGrade Methodology Infographic. Carbon Finance Lab. https://carbonfinancelab.com/wp-content/uploads/2026/02/inforgraphic_carbongrade.png
@misc{carbongrade_infographic_2026,
  author = {Carbon Finance Lab},
  title = {CarbonGrade Methodology Infographic},
  year = {2026},
  publisher = {Carbon Finance Lab},
  howpublished = {\url{https://carbonfinancelab.com/wp-content/uploads/2026/02/inforgraphic_carbongrade.png}}
}
Video
Video
The Carbon Ledger
Carbon accounting is undergoing the same transition financial accounting did in Renaissance Venice: from narrative descriptions to structured, double-entry ledgers. Six episodes plus a 14 MB editable companion deck.
Cite
Carbon Finance Lab (2026). The Carbon Ledger. Carbon Finance Lab. https://carbonfinancelab.com
@misc{carbon_ledger_series_2026,
  author = {Carbon Finance Lab},
  title = {The Carbon Ledger},
  year = {2026},
  publisher = {Carbon Finance Lab},
  howpublished = {\url{https://carbonfinancelab.com}}
}
Video
Video
CarbonGrade: Carbon Score Methodology
Walks through the CarbonGrade scoring methodology dimension by dimension — additionality, permanence, measurement uncertainty, co-benefits — explaining how each is assessed, weighted, and aggregated into a composite score. Audience: compliance officers through fund managers.
Cite
Carbon Finance Lab (2026). CarbonGrade: Carbon Score Methodology. Carbon Finance Lab. https://carbonfinancelab.com
@misc{carbongrade_method_video_2026,
  author = {Carbon Finance Lab},
  title = {CarbonGrade: Carbon Score Methodology},
  year = {2026},
  publisher = {Carbon Finance Lab},
  howpublished = {\url{https://carbonfinancelab.com}}
}
Video
Video
Carbon Accounting Fundamentals
Before carbon can be priced, traded, or offset, it has to be counted. The foundational primer: organisational boundaries, Scope 1/2/3, the methodological choices that decide whether your inventory is a useful management tool or a compliance artifact. Bedrock for everything downstream.
Cite
Carbon Finance Lab (2026). Carbon Accounting Fundamentals. Carbon Finance Lab. https://carbonfinancelab.com
@misc{carbon_accounting_fundamentals_2026,
  author = {Carbon Finance Lab},
  title = {Carbon Accounting Fundamentals},
  year = {2026},
  publisher = {Carbon Finance Lab},
  howpublished = {\url{https://carbonfinancelab.com}}
}The Carbon Ledger
Six episodes on the transition from narrative carbon disclosure to structured, double-entry ledgers. Watch in order or skip to the part you need. Each episode has its own anchor (#ep-N) for sharing.
The Ledger Shift: Redefining Carbon Accounting
Carbon accounting is undergoing the same transition financial accounting did in Renaissance Venice: from narrative descriptions of obligation to structured, double-entry ledgers. Frames the shift from voluntary disclosure prose to machine-readable, jurisdictionally anchored emissions data.
Architecting the Ledger: Regulatory Carbon Accounting
Walks through the emerging regulatory stack — CSRD/ESRS in Europe, IFRS S2/ISSB globally, the SEC climate rule. Architectural rather than doctrinal: where controls sit, which data pipelines need assurance, how Scope 3 gives way to auditable asset-level evidence.
Carbon: Chaos to Clarity
Carbon markets today resemble capital markets before standardisation. Traces the path toward clarity: convergence of measurement standards, independent rating agencies, registry consolidation, shared data infrastructure. Drawing on parallels from bond ratings and exchange-listed commodities.
Carbon: Count to Control
Counting carbon is only the first step; the harder work is controlling it. The translation from raw emissions data into management accounting — internal carbon prices, carbon budgets, variance analysis, incentive systems. The unglamorous machinery that turns a CO&sub2; tonne into a lever for capital allocation.
Carbon: Count to Account
A two-minute primer on a distinction that gets elided but matters: counting carbon (a physical inventory at a point in time) versus accounting for it (recording flows in a periodic, ledgered system). One produces a number; the other produces a narrative comparable across periods, entities, and jurisdictions.
Carbon's New Language
Brief orientation to the vocabulary: Scopes 1, 2, 3, organisational and operational boundaries, activity data versus emission factors, CO&sub2;-equivalence, the GHG Protocol. Shared language is a precondition for shared markets. Most practical disagreements trace to incompatible word use.
Methodology & primers
Two standalone explainers outside the Carbon Ledger series.
CarbonGrade: Carbon Score Methodology
Walks through the CarbonGrade scoring methodology dimension by dimension — additionality, permanence, measurement uncertainty, co-benefits — explaining how each is assessed, weighted, and aggregated into a composite score. Audience: compliance officers through fund managers.
Carbon Accounting Fundamentals
Before carbon can be priced, traded, or offset, it has to be counted. The foundational primer: organisational boundaries, Scope 1/2/3, the methodological choices that decide whether your inventory is a useful management tool or a compliance artifact.
Last updated: May 22, 2026
Disclaimer: Publications are for informational purposes only and do not constitute investment advice.